
Tracking downtime on machines you can't open up
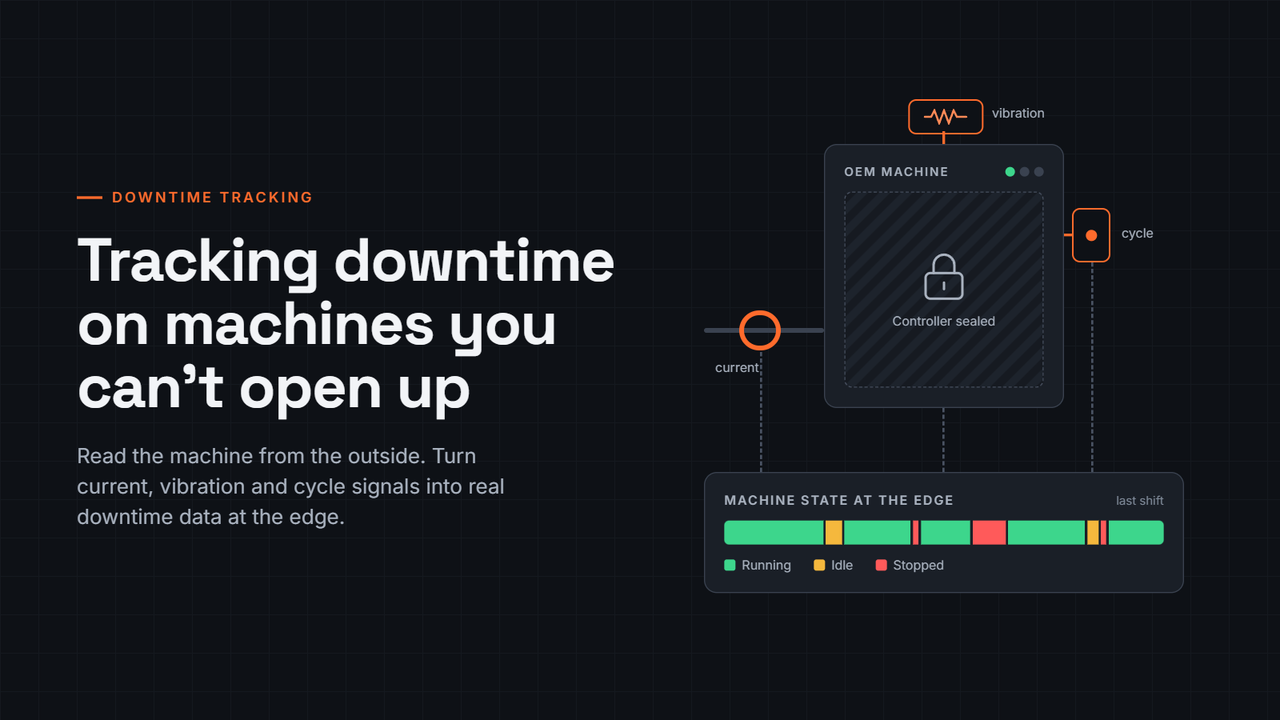
You don't need the OEM's permission to know when your machine stopped. Every machine leaks evidence of what it is doing: the current its motors draw, the vibration in its frame, the parts passing a sensor, the color of its stack light. Capture those signals from the outside, process them at the edge, and you can track downtime on equipment you are not allowed, or not able, to open up.
Most plants have at least one of these machines. A packaging line under a service contract that voids if you touch the controller. A press with a proprietary HMI and no exposed tags. A 25-year-old lathe whose builder went out of business. The OEM either won't share the data, wants a subscription for it, or never collected it in the first place. Meanwhile the machine sits in the middle of the value stream, and nobody can say with confidence how many hours it lost last month or why.
This post walks through how to measure downtime on those machines without modifying them: which signals to read, how to turn them into reliable states, how to move the data from the plant floor to wherever you analyze it, and how to keep the whole thing secure.
Why the blind spot is expensive
Unplanned downtime is one of the largest controllable costs in manufacturing. Siemens estimates that it costs the world's 500 largest companies about $1.4 trillion a year, roughly 11% of their revenue, and that an idle line in automotive runs about $2.3 million per hour (Siemens, 2024). Most plants are nowhere near that scale, but the ratio holds: an hour lost on a bottleneck machine is an hour of output the whole line never gets back.
The standard way to account for that loss is Overall Equipment Effectiveness (OEE), which Seiichi Nakajima introduced as the core measure of Total Productive Maintenance. OEE multiplies availability, performance and quality, and Nakajima framed the gap to 100% as six big losses: breakdowns, setup and adjustments, idling and minor stoppages, reduced speed, process defects and reduced yield (Nakajima, 1988). Muchiri and Pintelon (2008) later reviewed how the metric spread across industry and how practice drifts from theory once plants start measuring it.
The catch is that OEE is only as good as the stop data underneath it. Ljungberg (1998), studying roughly 20 cases, found typical OEE around 55%, and argued that manual logging misses much of the loss because short, frequent stops come to be seen as normal. Bengtsson and colleagues at Volvo Construction Equipment make the same point two decades later: minor stoppages are hard to measure, so they are often estimated from operator experience instead of recorded (Bengtsson et al., 2022).
On a machine you can't open, the paper log is usually the only record. That means the losses most likely to be invisible are exactly the ones you have no way to see.
Read the machine from the outside
If you can't read the controller, read what the controller causes. Four families of signals cover almost every machine, and none of them requires touching the OEM's logic, wiring or warranty.
Electrical current. A split-core current transformer clipped around a motor lead or the main feeder tells you whether the machine is drawing working load, idling or off. The Advanced Manufacturing Research Centre (AMRC) at the University of Sheffield used exactly this on legacy machine tools: if current rose above a calibrated limit, the machine was counted as running, and on-time versus off-time gave a utilization percentage, with a sensor costing tens of pounds (AMRC, n.d.). Hansjosten et al. (2023) pushed the same idea further, sampling split-core transformers on drive power cables at 50 kHz to diagnose feed-axis condition, not just on/off state.
Vibration and acoustics. An accelerometer or acoustic sensor on the frame separates a machine that is powered but idle from one that is actually cutting, stamping or filling. It is especially useful where the motor runs continuously and current barely changes between load and no load.
Motion and part presence. A proximity sensor or photo-eye on something that moves once per cycle (a ram, a knife, an indexing table, the discharge chute) gives you cycle counts and cycle times. Those are what turn availability into performance, because they reveal slow running, not just stopped running.
Existing indicators. Stack lights, horns and dry contacts on the OEM panel already encode the machine's own idea of its state. Tapping the 24 V signal to a stack-light segment through an isolated input is often the cheapest way to tell "faulted" from "waiting for material."
One signal rarely tells the whole story. Pair a primary signal (current or cycle) with a corroborating one (vibration or stack light), and you can tell a jam from a starved machine from a planned stop.
Turn signals into states, then into reasons
Raw signals are not downtime. A current trace that dips for 400 milliseconds during a tool change is not a stop; one that sits at idle for six minutes probably is. The job of the first layer of software is to turn noisy measurements into a small set of clean, timestamped states, typically Running, Idle, Stopped and Off, plus Faulted if you have a signal for it.
A few rules make that layer trustworthy:
- Smooth before you threshold. Use a running RMS or moving average over a short window instead of instantaneous peaks, so switching transients don't create phantom starts.
- Calibrate thresholds from data. Record a few shifts, look at the actual current or vibration levels in each state, and set limits with margin, rather than guessing from a nameplate.
- Use hysteresis and minimum durations. A state change only counts once the new condition has held for a set time. That single rule removes most chatter.
- Decide your micro-stop cutoff explicitly. Nakajima's framework doesn't fix a number of seconds or minutes that separates a minor stoppage from a breakdown (Nakajima, 1988), so pick one that fits the process, write it down and keep it consistent across machines. ISO 22400-2 gives standard KPI definitions you can align to.
- Treat "unknown" as a state. When sensors disagree or go quiet, record it as unknown rather than forcing a guess. A sensor failure should never look like a perfect shift.
States tell you when the machine stopped; they don't tell you why. For that you still need people, but far less of their time. Once the system detects a stop, it can prompt the operator for a reason code on a tablet or HMI at the line, with a short list built from your own six-big-loss categories. The operator is answering one question about a stop that the system already timed, not reconstructing a shift from memory. That shift, from logging time to labeling events, is where most of the accuracy gain comes from.
Process at the edge, analyze anywhere
The sensors are the easy part. The architecture behind them decides whether the data is trustworthy, timely and useful beyond one machine. The pattern that works is edge to cloud: process close to the machine, then publish clean events to wherever people analyze them.

Shi et al. (2016) describe edge computing as handling data near where it is produced, and give the main reasons to do so: response time, bandwidth cost and data privacy. All three apply on the plant floor. State detection needs millisecond-level samples that nobody wants to ship to a data center. A wide-area link that drops for an hour should not erase an hour of downtime history. And raw machine data often should not leave the building at all.
In practice, an edge node next to the machine does four things:
- Acquires the raw signals from current transformers, accelerometers and discrete inputs.
- Decides the machine state with the rules described above, and timestamps every transition locally.
- Buffers events so that a network outage delays the data instead of losing it (store and forward).
- Publishes state changes, counts and reason codes as compact messages.
MQTT is the common choice for that last step. It is an open OASIS standard built on a lightweight publish/subscribe model (Banks et al., 2019), so the edge publishes once and any number of consumers, from a historian to an OEE dashboard to a maintenance system, subscribe without new point-to-point integrations. Organizing topics by site, area, line and machine gives every downtime event a consistent address, which is what lets you compare a 1998 press with a 2024 filler on the same screen.
Stay out of the OEM's way, and keep it secure
The whole point of measuring from the outside is that the OEM's control loop stays exactly as it was. Keep it that way on the network too. The monitoring system should be a separate, read-only path that never writes to the machine and never depends on the machine's controller being reachable.
NIST's guide to operational technology security recommends defense in depth and network segmentation for exactly this kind of system: OT assets grouped into zones, with tightly controlled conduits between them and between OT and the business network (Stouffer et al., 2023). For a downtime project, that translates into a few practical rules:
- Put the sensors and edge node on their own segment, not on the flat plant network.
- Make every connection outbound from the plant. Nothing on the internet should be able to open a session into the floor.
- Authenticate both ends of every connection and encrypt traffic, including between edge and broker.
- Don't hand out a site-wide VPN to see a dashboard. Give people access to the data, not to the network the machines sit on.
Done this way, the monitoring layer adds visibility without adding a new path for an attacker, and IT has something it can actually sign off on.
A practical rollout in five steps
- Pick the machine that hurts most. Start with the bottleneck or the machine with the loudest complaints, not the easiest one. One well-instrumented constraint teaches more than ten easy machines.
- Walk it with the operator and the electrician. Identify one primary signal (current on the main motor, or a once-per-cycle motion) and one corroborating signal (vibration or a stack-light segment). Confirm every sensor can be installed without opening the OEM's control cabinet logic.
- Record before you decide. Run for a week with no dashboards. Use the data to calibrate thresholds, minimum durations and the micro-stop cutoff, and compare the result with the paper log for the same days.
- Add reason codes at the line. Once states are stable, prompt operators to classify stops, using a short list mapped to your loss categories. Review the unclassified and "unknown" time weekly.
- Template it and scale. Package the sensor kit, edge configuration and data model so the second machine is a copy, not a project. Then expand across the line and, eventually, across sites.
The first comparison between the sensor record and the paper log is usually the moment the project sells itself. The gap between the two is the downtime you've been paying for without knowing it.
Get to know EmberNet
If you want to put this into practice, take a look at EmberNet, an edge-to-cloud platform built by controls engineers for brownfield plants. It runs on an industrial PC placed in front of the equipment you already have, so the existing controller keeps running untouched, and it brings the historian, MQTT broker and zero-trust networking with it. You can start on one machine under the free Pilot tier, which does not expire.
Bring us the machine that costs you the most downtime today. Fireball Industries, EmberNet's master systems integrator, can help you instrument it and get your first real downtime numbers.
References
- Advanced Manufacturing Research Centre (AMRC). (n.d.). Digitalisation of legacy machine tools [White paper]. University of Sheffield. https://www.amrc.co.uk/files/document/239/1542365809_WHITE_PAPER_LEGACY_AW.pdf
- Banks, A., Briggs, E., Borgendale, K., & Gupta, R. (Eds.). (2019). MQTT Version 5.0 (OASIS Standard). OASIS. https://docs.oasis-open.org/mqtt/mqtt/v5.0/mqtt-v5.0.html
- Bengtsson, M., Alm, P., & Tjulin, B. (2022). Visualizing the effects of chronic versus sporadic losses in manufacturing industries: A case study. In A. H. C. Ng et al. (Eds.), SPS2022 (pp. 3–14). IOS Press. https://doi.org/10.3233/ATDE220121
- Hansjosten, M., Bott, A., Puchta, A., Gönnheimer, P., & Fleischer, J. (2023). Model-based diagnosis of feed axes with contactless current sensing. In Production at the Leading Edge of Technology (WGP 2022). Springer. https://doi.org/10.1007/978-3-031-18318-8_33
- International Organization for Standardization. (2014). ISO 22400-2:2014 Automation systems and integration — Key performance indicators (KPIs) for manufacturing operations management — Part 2: Definitions and descriptions. ISO.
- Ljungberg, Ö. (1998). Measurement of overall equipment effectiveness as a basis for TPM activities. International Journal of Operations & Production Management, 18(5), 495–507. https://doi.org/10.1108/01443579810206334
- Muchiri, P., & Pintelon, L. (2008). Performance measurement using overall equipment effectiveness (OEE): Literature review and practical application discussion. International Journal of Production Research, 46(13), 3517–3535. https://doi.org/10.1080/00207540601142645
- Nakajima, S. (1988). Introduction to TPM: Total productive maintenance. Productivity Press.
- Shi, W., Cao, J., Zhang, Q., Li, Y., & Xu, L. (2016). Edge computing: Vision and challenges. IEEE Internet of Things Journal, 3(5), 637–646. https://doi.org/10.1109/JIOT.2016.2579198
- Siemens. (2024). The true cost of downtime 2024. Siemens AG. https://assets.new.siemens.com/siemens/assets/api/uuid:1b43afb5-2d07-47f7-9eb7-893fe7d0bc59/TCOD-2024_original.pdf
- Stouffer, K., Pease, M., Tang, C., Zimmerman, T., Pillitteri, V., Lightman, S., Hahn, A., Saravia, S., Sherule, A., & Thompson, M. (2023). Guide to operational technology (OT) security (NIST SP 800-82r3). National Institute of Standards and Technology. https://doi.org/10.6028/NIST.SP.800-82r3